Seismic Refraction Survey is a part of the geotechnical investigation. In this article, you will find seismic refraction method and its procedure for the classification of soil and determining the soil layer thickness.
Seismic Refraction Survey
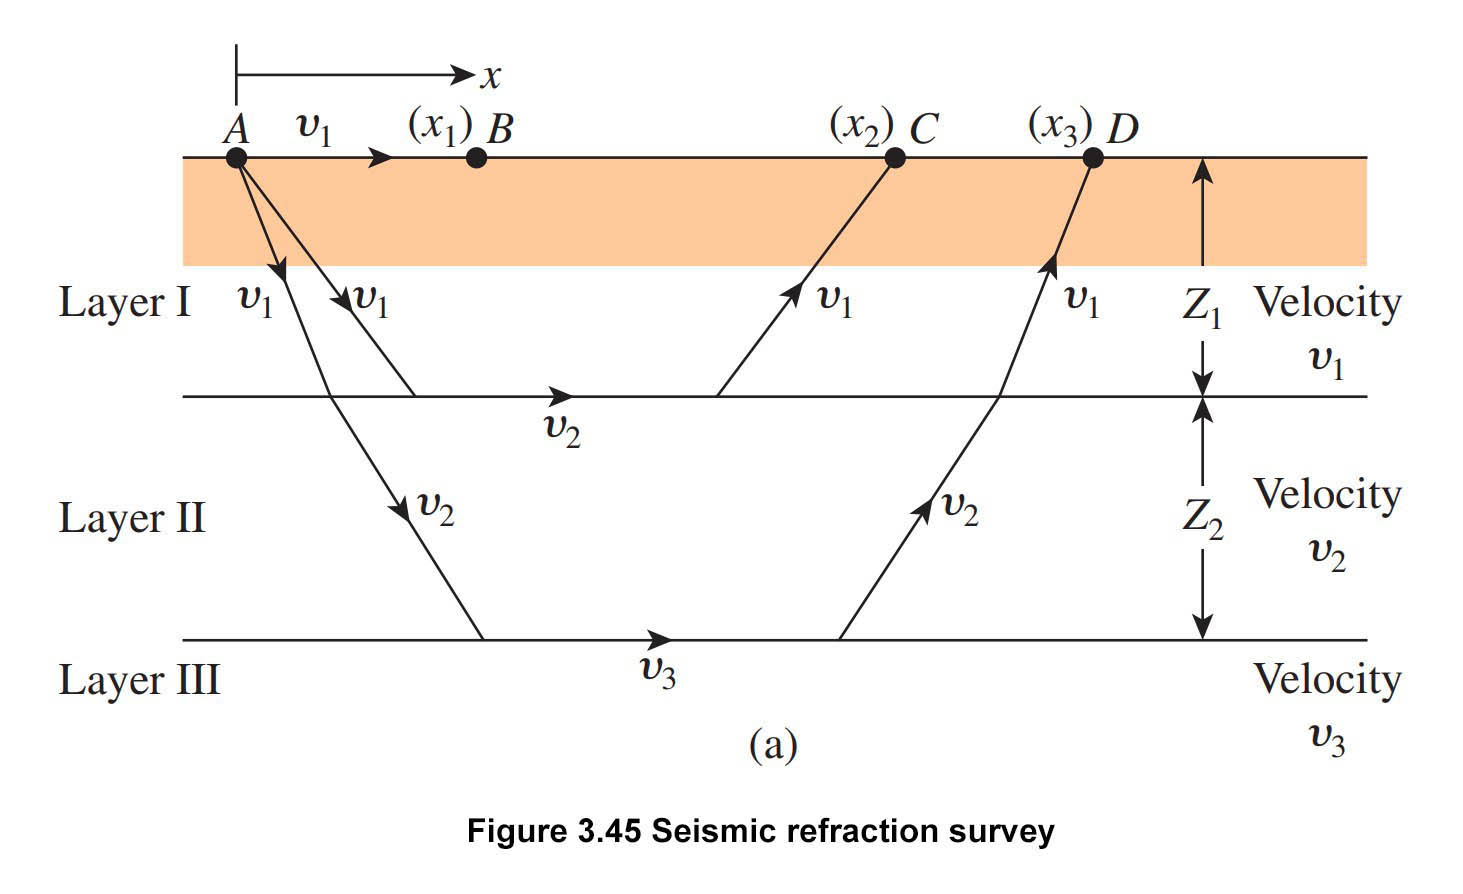
Seismic refraction survey is useful in obtaining preliminary information about the thickness of the various soil layers and the depth of rock or hard soil at a large site. Seismic refraction surveys are conducted by impacting the soil surface, such as at point A in Figure 3.45a, and observing the first arrival of the stress waves (disturbance) at several other points (e.g., B, C, D, ….). The impact can be created by a small explosion or hammer blow. Geophones can record the first arrival of disturbance waves at several points.
The impact on the ground surface creates two types of waves, one is P-waves (plane waves or compression waves) and another called S-waves (or shear waves). P-waves are faster than S-waves that’s why the first arrival of disturbance waves will be related to the velocities of the P-waves in various soil layers.
The velocity of the P-wave:
\upsilon \text{ }=\text{ }\sqrt{\frac{{{E}_{s}}}{\left( \frac{\gamma }{g} \right)}\frac{\left( 1-{{\mu }_{s}} \right)}{\left( 1-2{{\mu }_{s}} \right)\left( 1+{{\mu }_{s}} \right)}} \tag{3.79}Where
Es = modulus of elasticity of the medium
γ = unit weight of the medium
g = acceleration due to gravity
μs = Poisson’s ratio
Seismic Reflection Survey Method
Step 1: Obtain the times of the first arrival, t1, t2, t3, t4,. . . ., at various distances x1, x2, x3, x4,. . . , from the point of the impact.
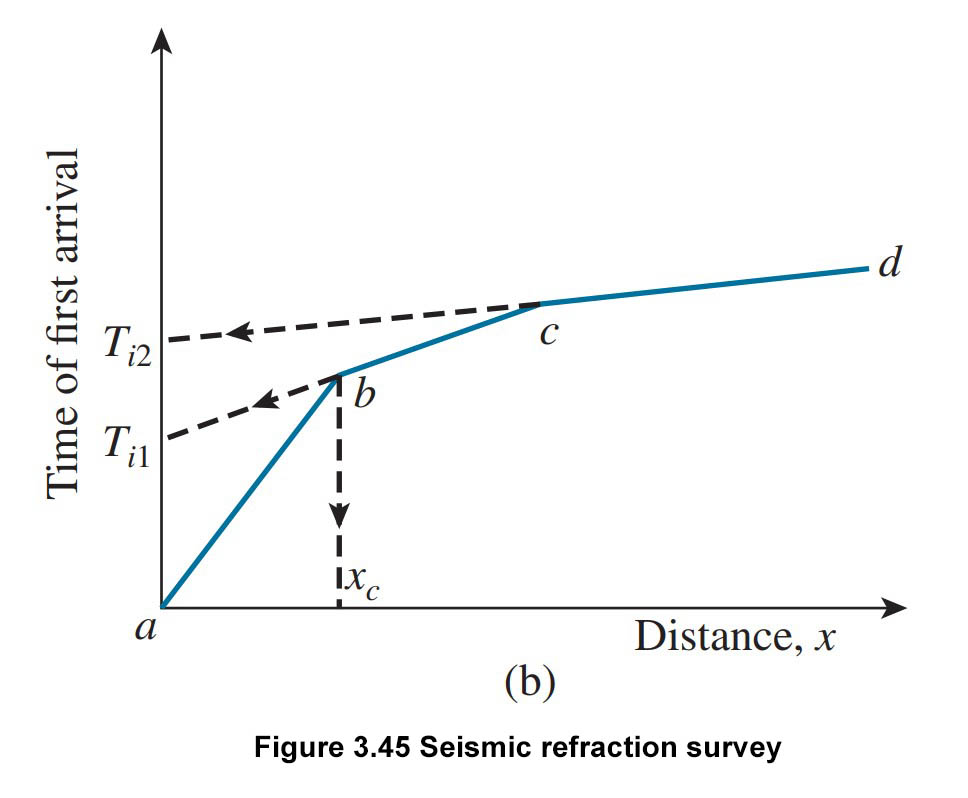
Step 2: Plot a graph of time t against distance x. The graph will look like the below Figure 3.45b.
Step 3: Calculate the slopes of the lines 0a, ab, bc, ….., :
Slope\text{ }of\text{ }0a=\frac{1}{{{\upsilon }_{1}}}Slope\text{ }of\text{ }ab=\frac{1}{{{\upsilon }_{2}}}Slope\text{ }of\text{ }bc=\frac{1}{{{\upsilon }_{3}}} Here, ![]() . . . . , are p-wave velocities in layers I, II, III, . . . . ., respectively (see figure 3.45a).
. . . . , are p-wave velocities in layers I, II, III, . . . . ., respectively (see figure 3.45a).
Step 4: Determine top layer thickness:
\tag{3.80}{{Z}_{1}}=\frac{1}{2}\sqrt{\frac{{{\upsilon }_{2}}-{{\upsilon }_{1}}}{{{\upsilon }_{2}}+{{\upsilon }_{1}}}}{{x}_{c}}The value of ![]() can be obtained from the plot which is shown in Figure 3.45b.
can be obtained from the plot which is shown in Figure 3.45b.
Step 5: Determine the second layer thickness:
\tag{3.81}{{Z}_{2}}=\frac{1}{2}\left[ {{T}_{i2}}-2{{Z}_{1}}\frac{\sqrt{\upsilon _{3}^{2}-\upsilon _{1}^{2}}}{{{\upsilon }_{3}}{{\upsilon }_{1}}} \right]\frac{{{\upsilon }_{3}}{{\upsilon }_{2}}}{\sqrt{\upsilon _{3}^{2}-\upsilon _{2}^{2}}}Note: If you have trouble viewing the equation then view the page in desktop mode in your mobile browser.
Here, ![]() is the time intercept of the line
is the time intercept of the line ![]() in Figure 3.45b, extended backward.
in Figure 3.45b, extended backward.
(For detailed derivations of this equation and other related information, see the research paper “Dobrin, 1960, and Das, 1992”.)
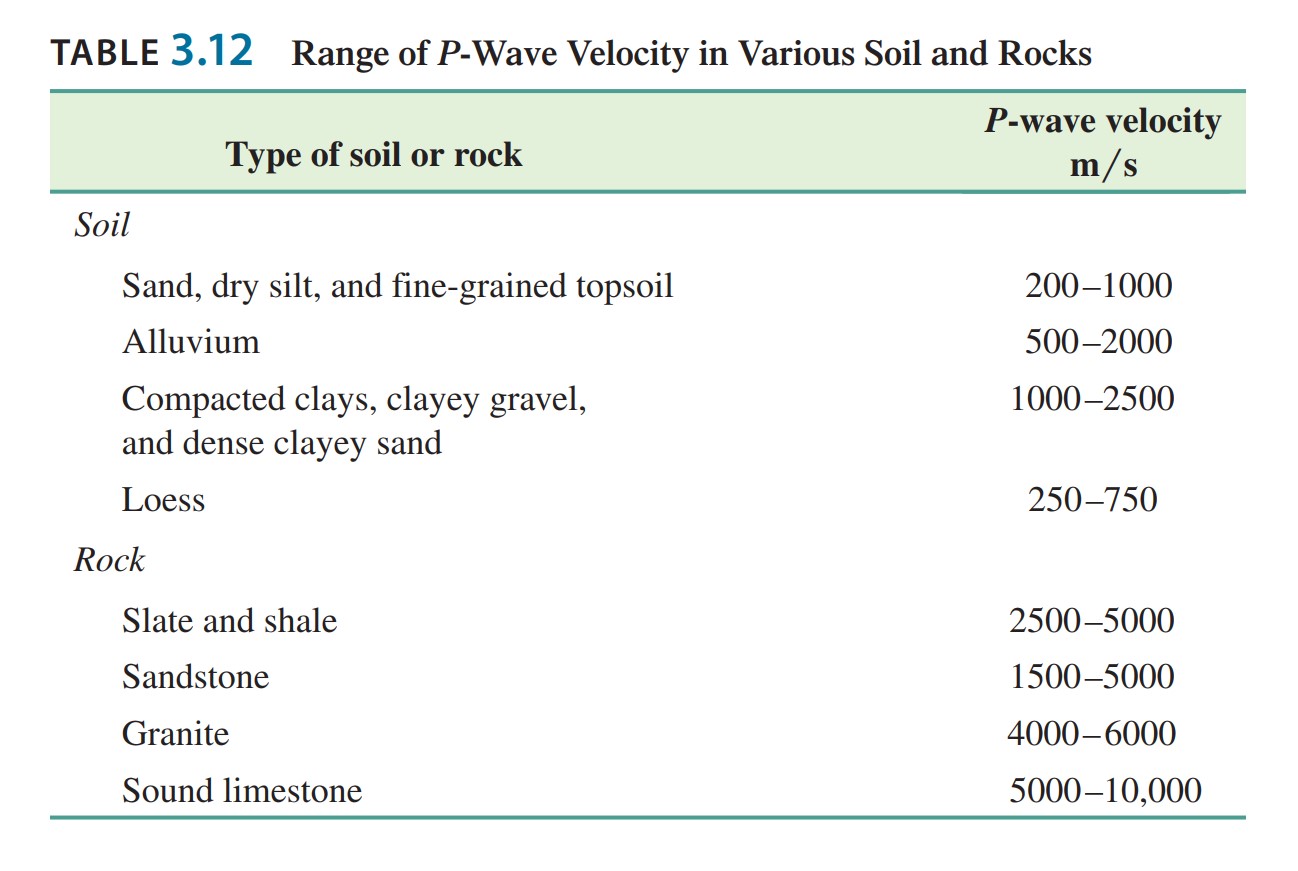
P-waves velocities indicate the types of soil or rock in various layers that are present below the ground surface. The range of the p-wave velocity that is encountered in different types of soil and rock at shallow depths is given below in Table 3.12.
Table 3.12: Range of P-Wave Velocity in Various Soil and Rocks
In Seismic refraction survey there have two limitations and that must be kept in mind when analyze the results.
Seismic Refraction Survey Limitations:
- The general equation for the survey – that is eq. (3.80) and eq. (3.81) – are base on the assumption that the P-wave velocity

- When a soil is saturated below the water table, the p-wave velocity may be incorrect. Through water, P-wave can travel with a velocity of about 1500 m/s. For dry soil, loose soil, the velocity may be well below 1500 m/s. However, in a saturated soil condition, the waves will travel through water that is present in the void space with a velocity of about 1500m/s. If the presence of groundwater has not been detected, then the p-wave velocity may be erroneously interpreted that indicating a stronger material like sandstone is actually present in situ. In general, geophysical results should always be verified by the result obtained from the soil boring test.
Now, at the end of this session, an example problem is given below for perfect understanding.
Example:
The result of a seismic refraction survey at a site are given below:
| Distance of geophone from the source of disturbance (m) | Time of first arrival (t x 10-3) |
|---|---|
| 2.5 | 11.2 |
| 5 | 23.3 |
| 7.5 | 33.5 |
| 10 | 42.4 |
| 15 | 50.9 |
| 20 | 57.2 |
| 25 | 64.4 |
| 30 | 68.6 |
| 35 | 71.1 |
| 40 | 72.1 |
| 50 | 75.5 |
Solution:
Velocity Calculation
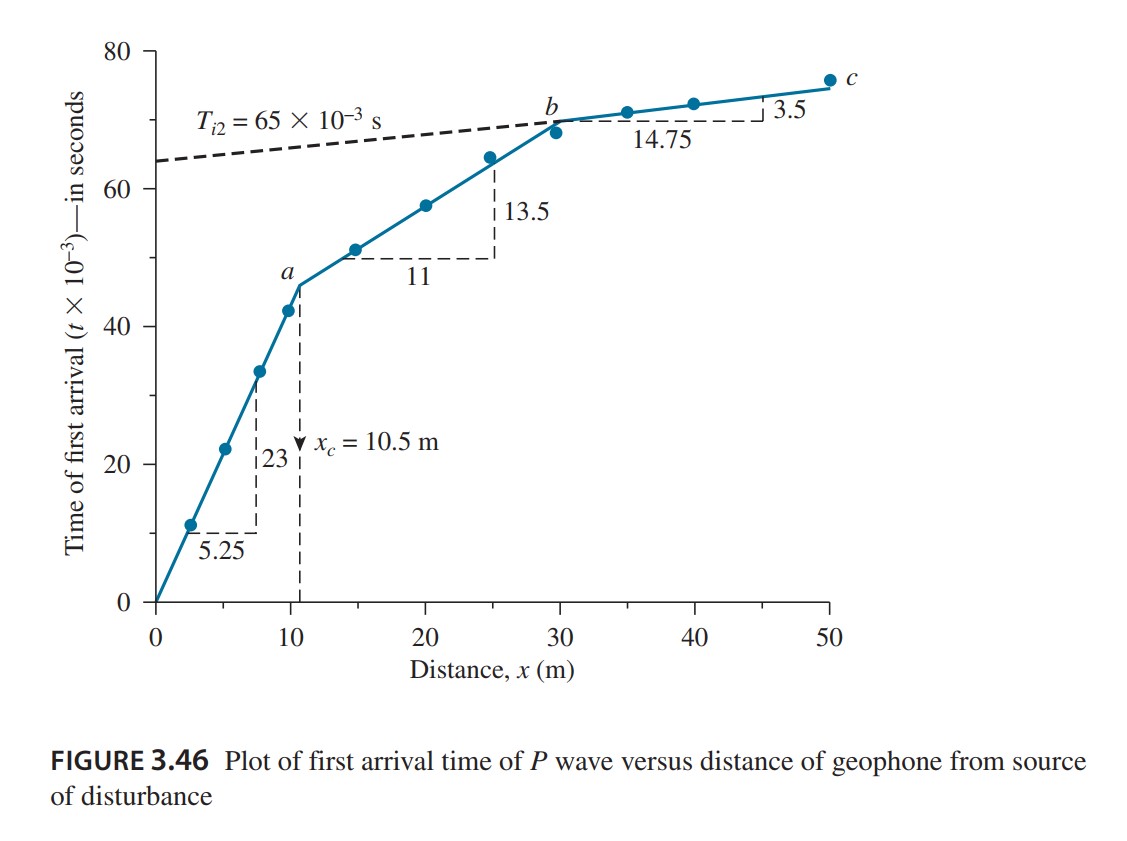
In Figure 3.46, the time of the first arrival of p-waves is plotted against the distance of the geophone from the source of disturbance (explosion or hammering). The plotted graph has three straight-line segments. The velocity of the top three layers can be calculated as:
Slope of segment:
0a=\frac{1}{{{\upsilon }_{1}}}=\frac{\text{time}}{\text{distance}}=\frac{23\times {{10}^{-3}}}{5.25}{{\upsilon }_{1}}=\frac{5.25}{23\times {{10}^{-3}}}=228\text{ m/s (top layer)}Slope of segment:
ab=\frac{1}{{{\upsilon }_{2}}}=\frac{13.5\times {{10}^{-3}}}{11}{{\upsilon }_{2}}=\frac{11}{13.5\times {{10}^{-3}}}=814.8\text{ m/s (middle layer)}Slope of segment:
bc=\frac{1}{{{\upsilon }_{3}}}=\frac{3.5\times {{10}^{-3}}}{14.75}{{\upsilon }_{3}}=\frac{14.75}{3.5\times {{10}^{-3}}}=4214\text{ m/s (third layer)}After analysis of the results given in Table 3.12, it indicates that the third layer is a Rock Layer.
Thickness of Layers
From Figure 3.46, ![]() , So
, So
{{Z}_{1}}=\frac{1}{2}\sqrt{\frac{{{\upsilon }_{2}}-{{\upsilon }_{1}}}{{{\upsilon }_{2}}+{{\upsilon }_{1}}}}{{x}_{c}}Thus,
{{Z}_{1}}=\frac{1}{2}\sqrt{\frac{814.8-228}{814.8+228}}\times 10.5=3.94mAgain, from (Eq. 3.81),
{{Z}_{2}}=\frac{1}{2}\left[ {{T}_{i2}}-2{{Z}_{1}}\frac{\sqrt{\upsilon _{3}^{2}-\upsilon _{1}^{2}}}{{{\upsilon }_{3}}{{\upsilon }_{1}}} \right]\frac{{{\upsilon }_{3}}{{\upsilon }_{2}}}{\sqrt{\upsilon _{3}^{2}-\upsilon _{2}^{2}}}The value of ![]() (from figure 3.46) is 65 x 10-3 s. Hence,
(from figure 3.46) is 65 x 10-3 s. Hence,
{{Z}_{2}}=\frac{1}{2}\left[ 65\times {{10}^{-3}}-2\times 3.94\frac{\sqrt{{{4214}^{2}}-{{228}^{2}}}}{4214\times 228} \right]\frac{4214\times 814.8}{\sqrt{{{4214}^{2}}-{{814.8}^{2}}}}=12.66mThus, the rock layer lies from the surface of the ground at a depth of:
{{Z}_{1}}+{{Z}_{2}}=3.94+12.66=16.60mNote: Equations and the number of equations which used in this article are taken from reference section source.
See this video to learn more about “what is seismic reflection?”
Watch this video for how to do seismic reflection surveys practically on the site.
Reference:
Principles of Foundation Engineering (Ninth edition, 2019), “Braja M. Das, University Sacramento”, “Nagaratnam Sivakugan, College of Science & Engineering James Cook University”
FAQ
What is seismic refraction survey?
Seismic refraction survey is a method of determining the classification of soil (e.g. clay, silt, sandstone, granite, etc.) and the thickness of various soil layers by using an artificial seismic such as a small explosion or hammering.


